Dashboards and KPIs – see the situation, development, and future direction
Revise EPM gathers the key business metrics, actuals, budgets, and forecasts into management dashboards.
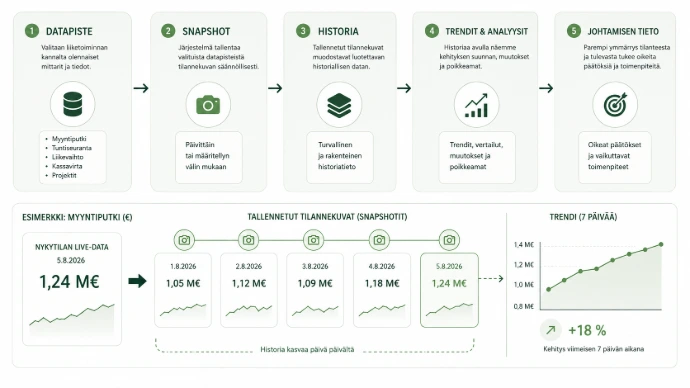
Historical snapshots can also be saved from selected data points. This way, constantly changing information forms a history that can help identify trends and review past situations.

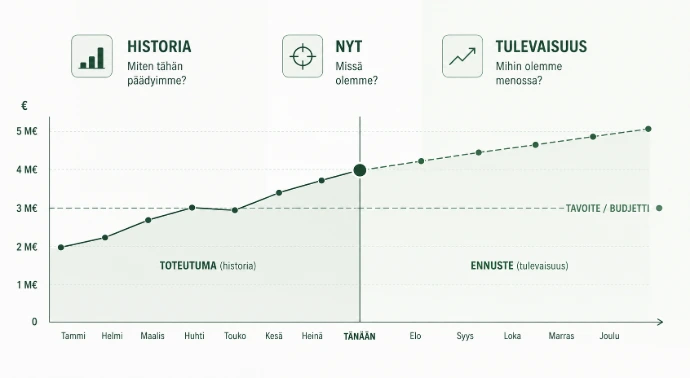
Where are we, how did we get here, and where are we going?
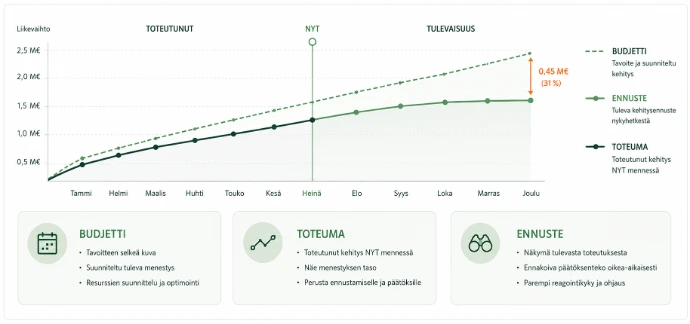
Business management needs more than today's numbers. Revise EPM combines three perspectives:
History tells how the business has evolved.
Current state tells where we are right now.
Future tells where we are going based on the budget and forecast.
KPI is not just a number – what matters is its development.
A single KPI indicates the current situation. From a management perspective, a benchmark and direction are also needed.
The metric can be viewed, for example, in relation to the goal, previous development, and forecast.
A good management metric helps answer:
- Where are we?
What was the goal? - How has the situation changed?
Where is the metric heading? - Are actions needed?
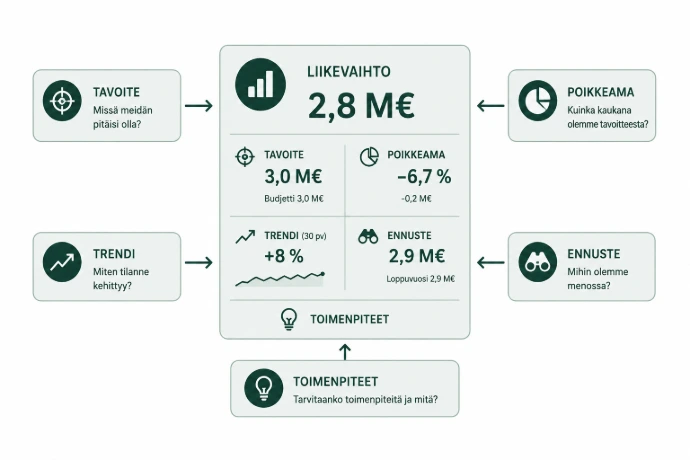
An overview at a glance
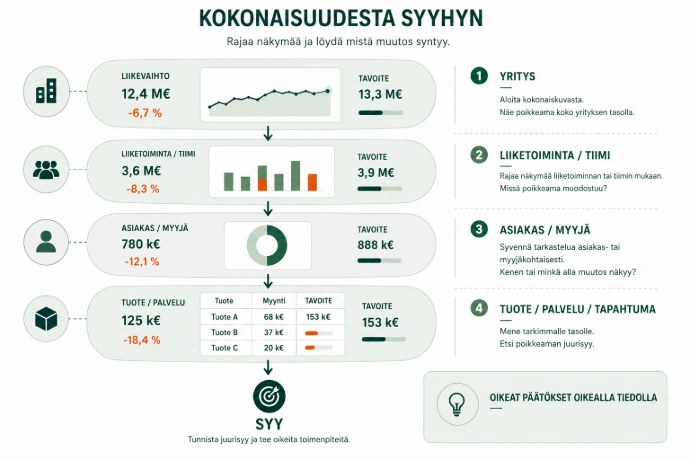
The purpose of the management dashboard is not to display all possible data. Its purpose is to highlight the essential matters for the company's management. The views can track, for example, the available data on:
sales
profitability
cash flow
customers
projects
activities*
budgets and forecasts
key KPI metrics
Not all important information retains its history by itself
Some business information is constantly changing.
For example, the value of today's sales pipeline indicates the current situation. As offers are won or lost, their values are changed or new opportunities arise, tomorrow's sales pipeline already looks different. In the implementation of Revise EPM, the data points are defined that will be monitored for long-term development. Regular historical snapshots of these data points are stored. The changing information of today can be turned into the history of tomorrow.
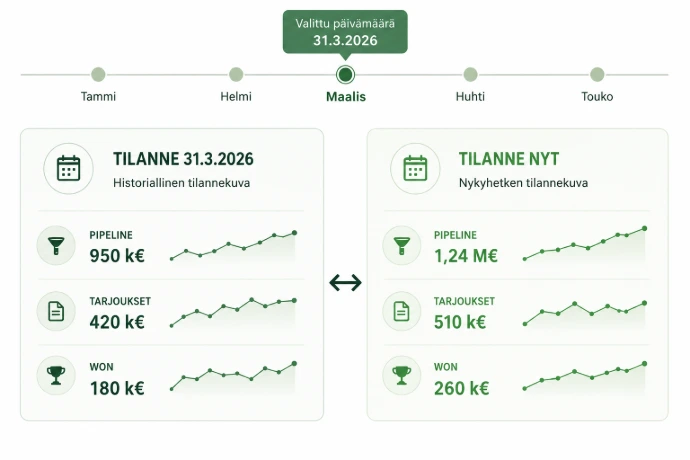
See what the business looked like at the selected time
As historical snapshots accumulate, we can examine, for example:
What did the sales pipeline look like a month ago?
How has the KPI developed over the last few months?
When did the direction of development change?
How does the current situation differ from the previous situation?
A single number tells the situation – the trend tells the direction
For example, today’s:
Pipeline €1.2 M
may look good as a single number.
But the historical development:
€1.8 M → €1.6 M → €1.4 M → €1.2 M
indicates that the pipeline has decreased significantly.
The trend can completely change the interpretation of a single KPI.
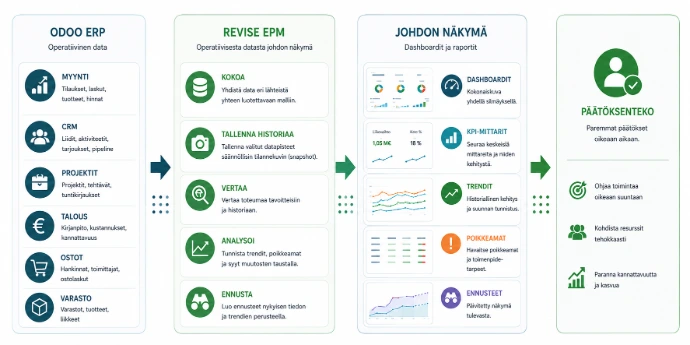
From operational data to management view
See more than just today’s numbers
Revise EPM gathers key metrics, goals, historical development, and forecasts into a management view.
See where the company is now, how the situation has come about, and where the business is developing based on current information.